Project Overview
Smarkets has a wide variety of political markets that are incredibly active in leading up to events. We were curious if we could use the data generated by these events to create a real-time crowdsourced opinion poll from the trading activity.
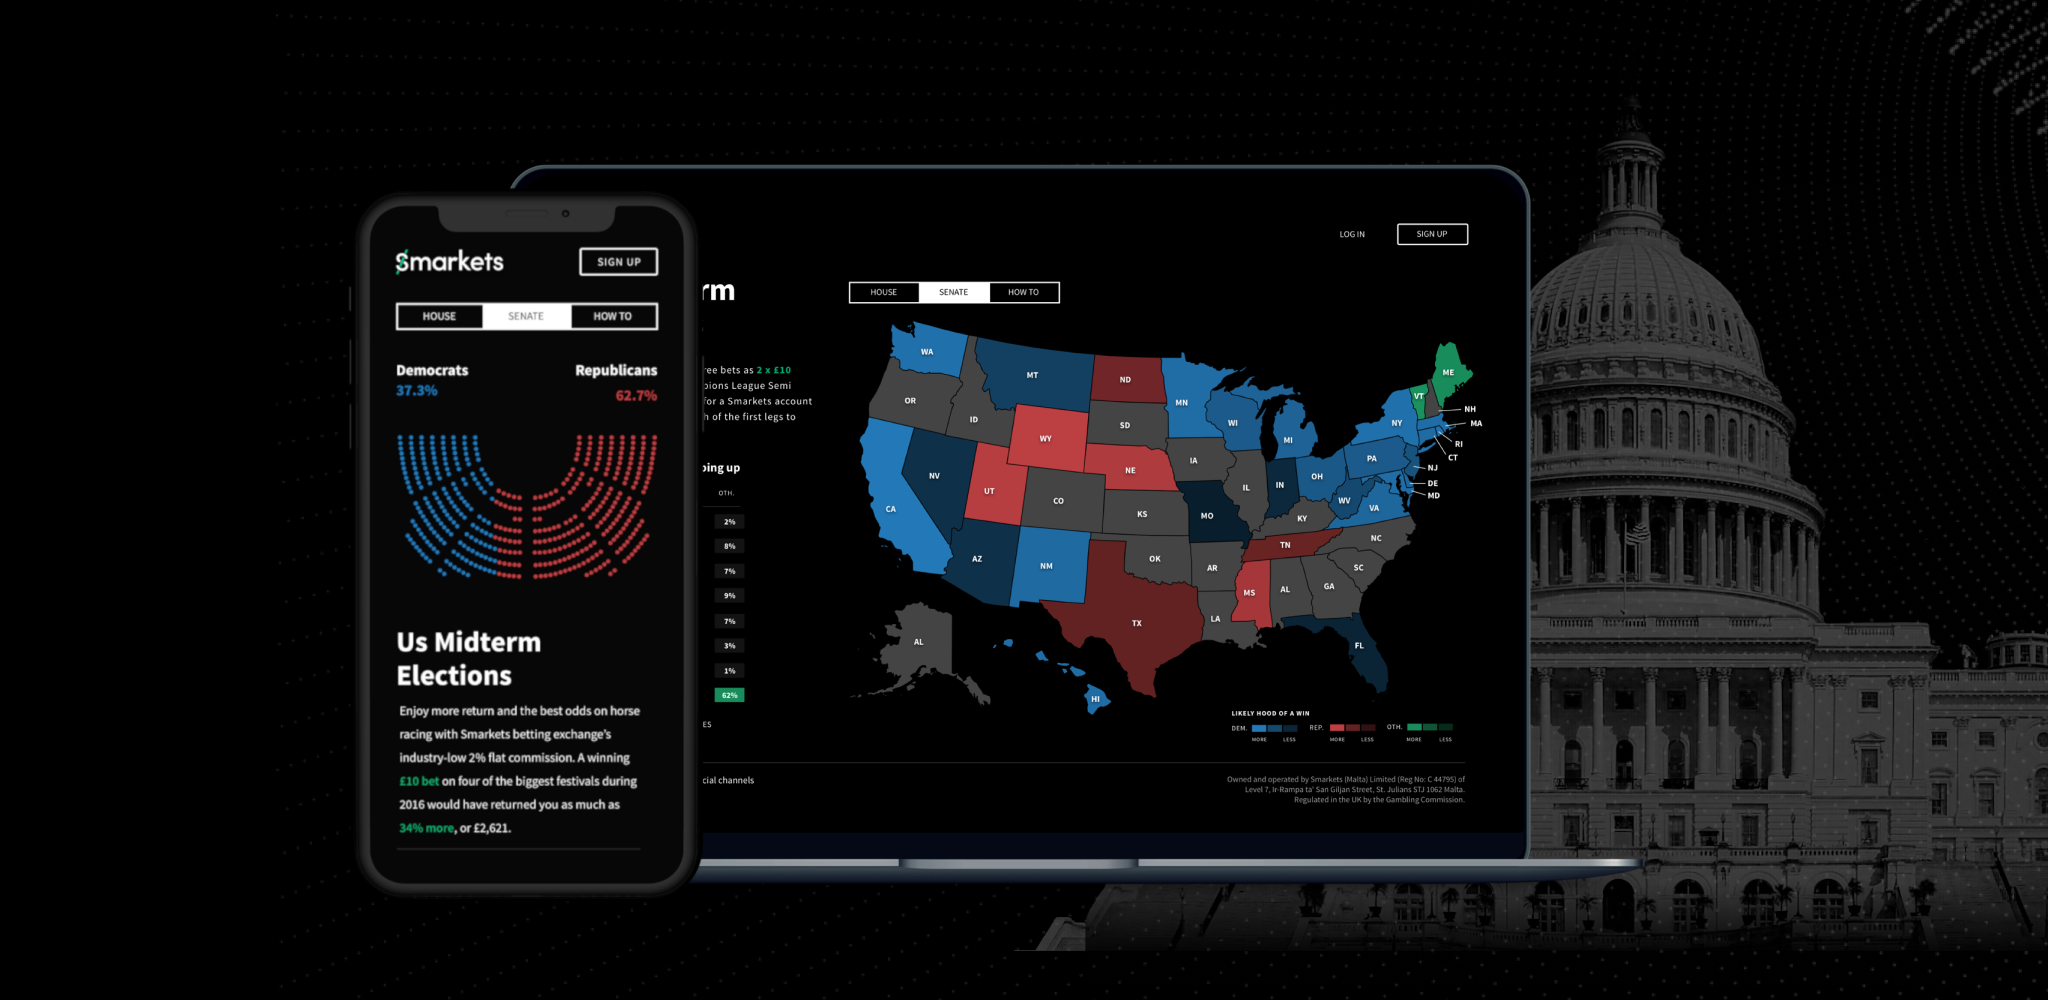
The end goal was to produce a sharable and engaging web page to reference when reviewing outcomes. We decided to use the 2018 US midterms for testing this. One issue that we had was the timescale for the project; it was three weeks.
Process
- Workshop
- High fidelity designs
- Development
- Retrospective
Workshop
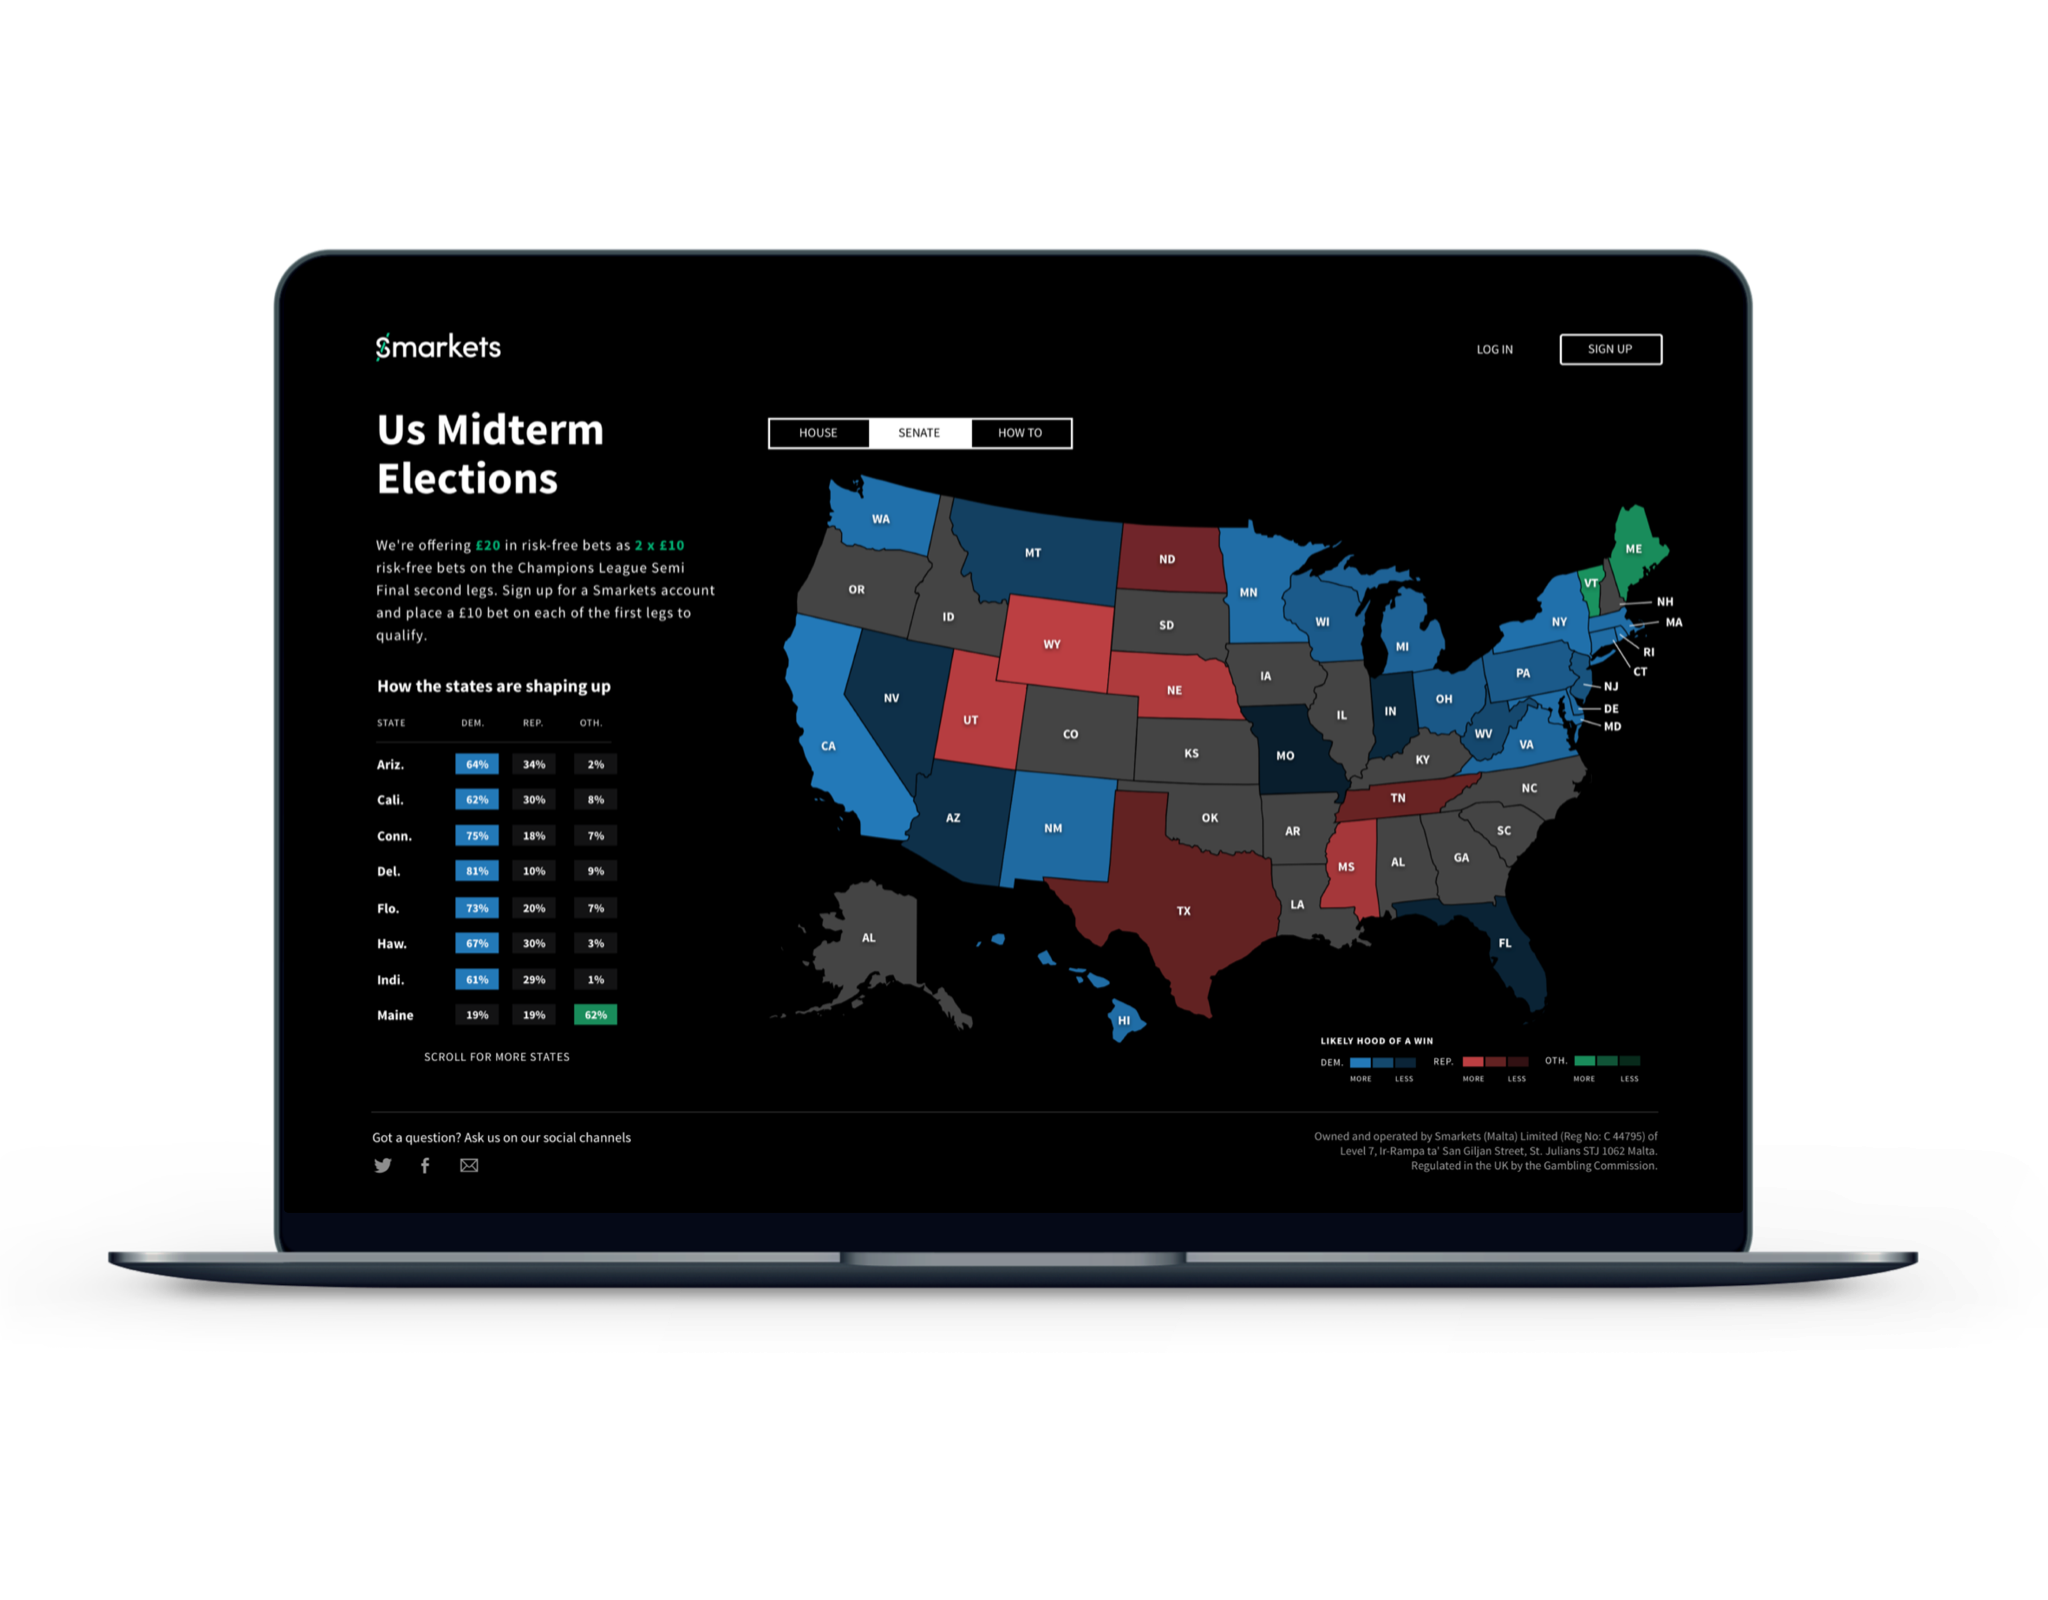
As the intent of this project was to create something shareable and engage a niche audience, I worked with both Smarkets PR and Political correspondents to help identify what would be of interest to them. As both of these interact with this audience daily. By the end of our workshop, the consensus was to create a visual representation of both elections.
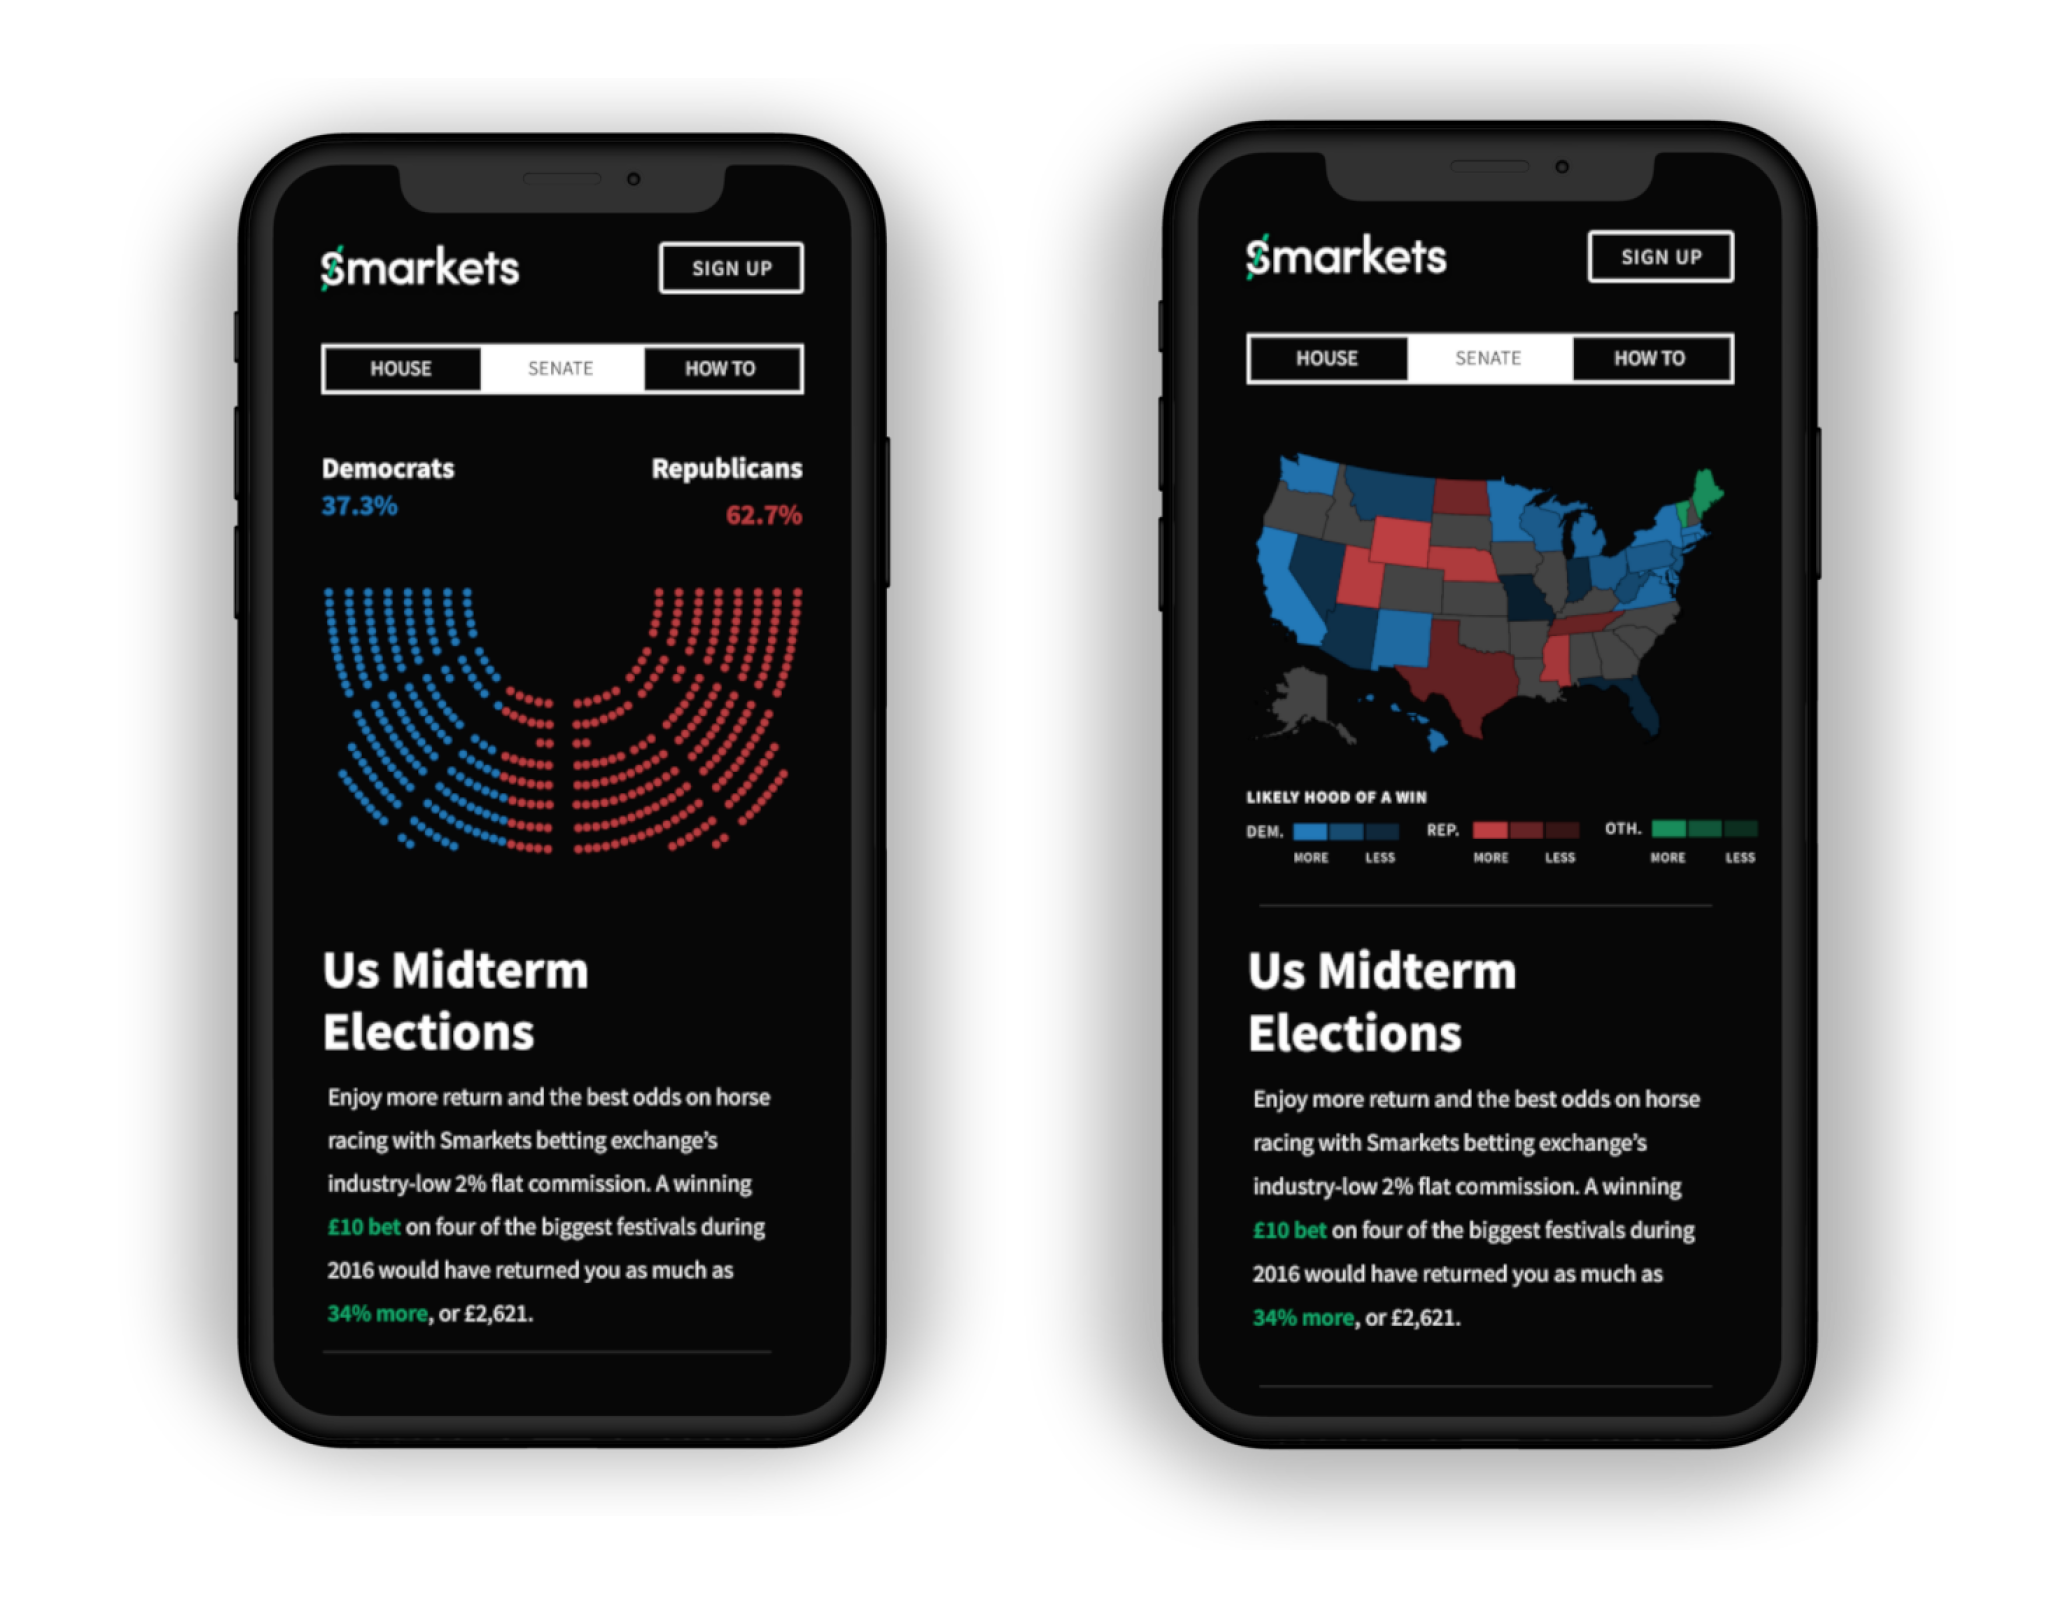
We decided to follow the example set by most major news sites to produce a state map and a map of the house seats. Each would allow us to show where was being contested, and we could fill this with colour to show the party in the lead.
High Fidelity Designs
We decided to build a landing page for hosting the final designs. The beg deciding factor here was that it would strip away a lot of the complexity introduced by the Smarkets website and would therefore appeal to those not interested in betting if that wasn't such a significant factor. I was constantly in contact with both the PR and Politics teams during this stage to ensure that the language was correct and that what we did followed what major news sites did when they released political updates.
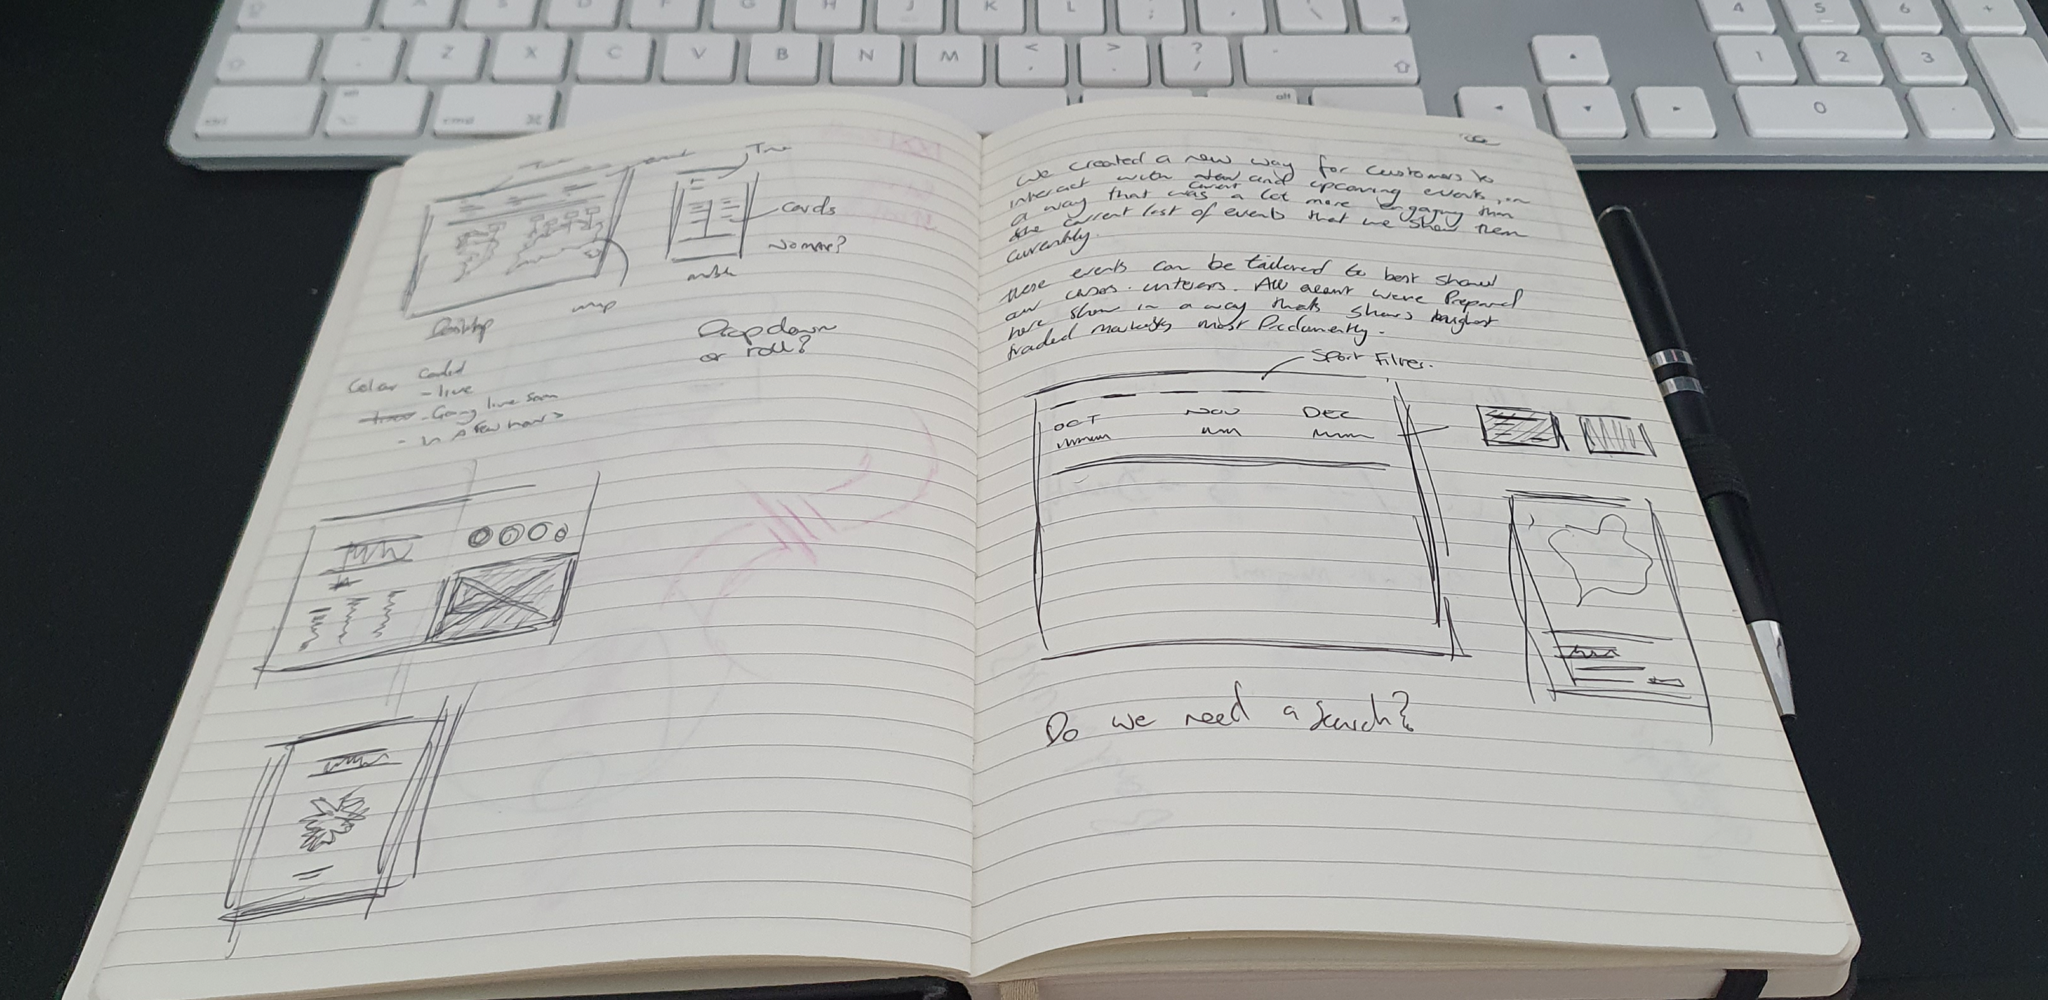
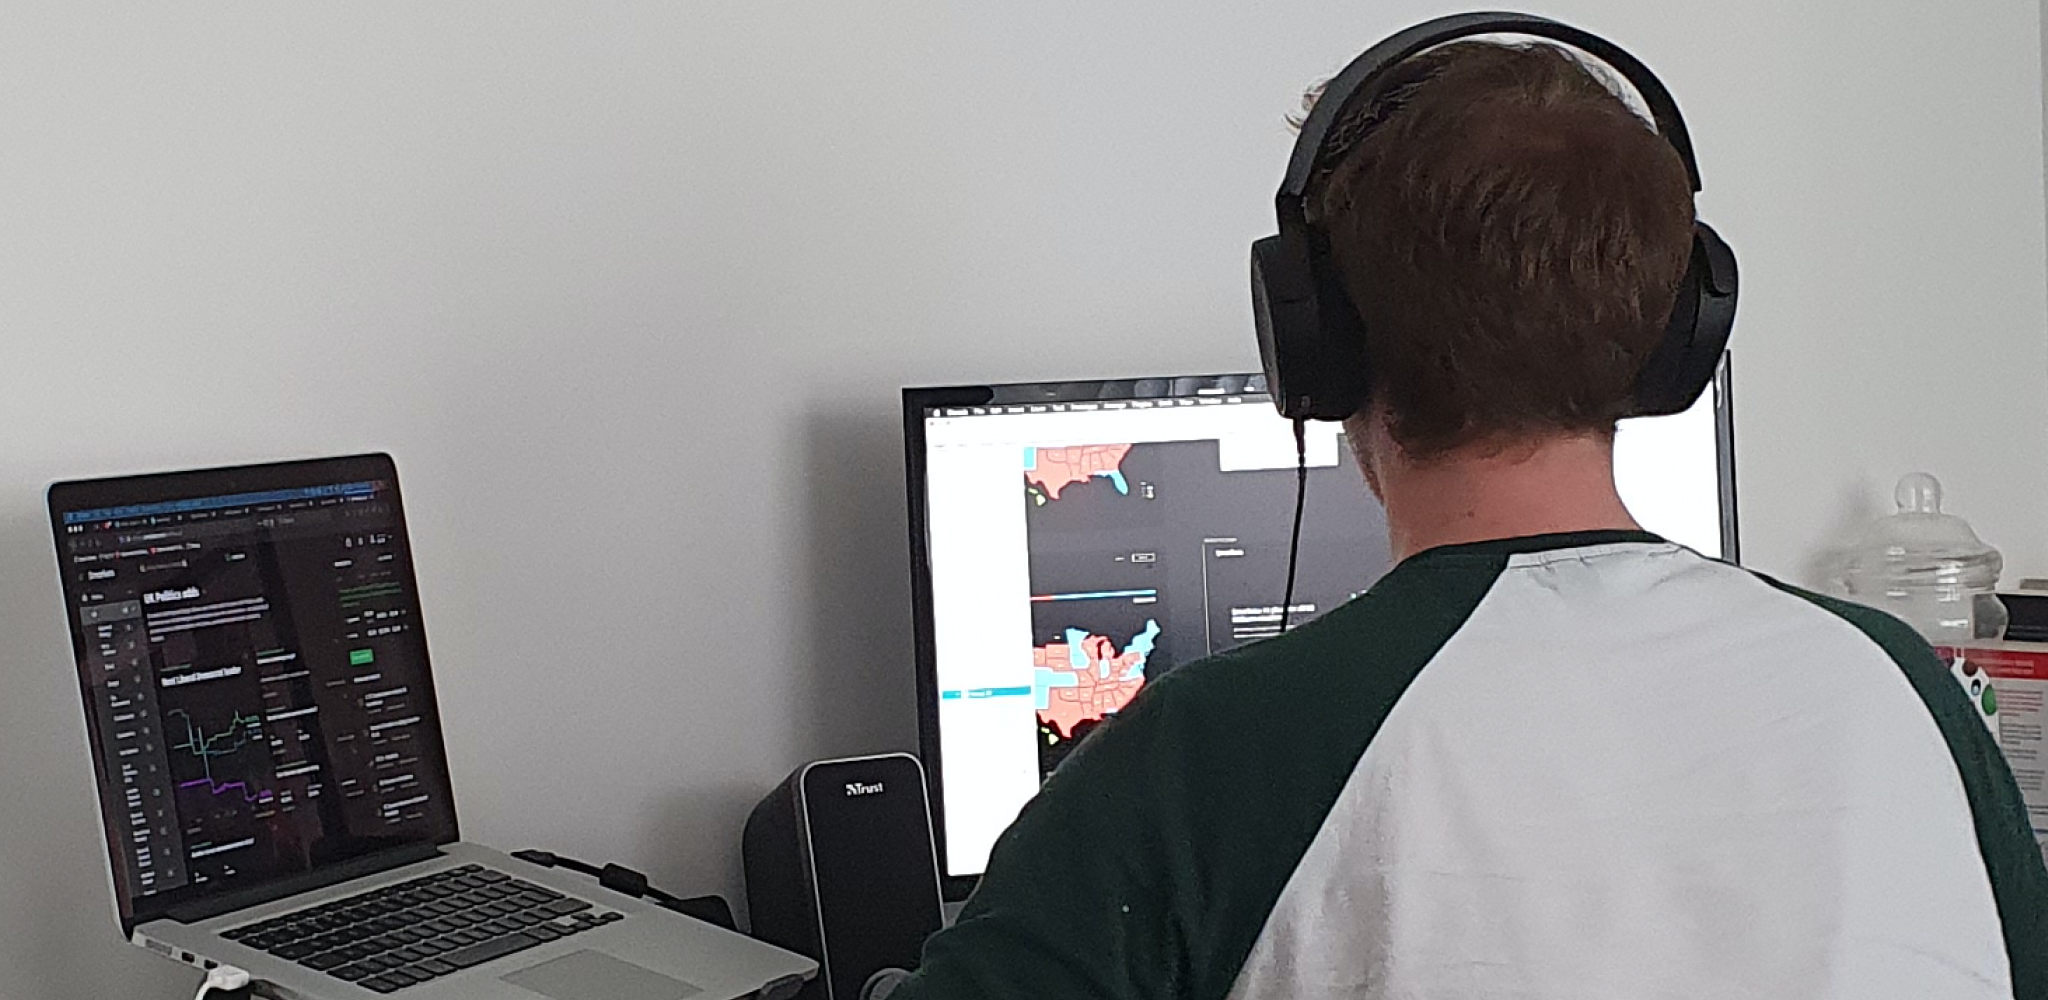
Development
The timeframe for this project was tight, and the goal was likely to be complex; this meant that the developers used our wireframes to get a rough understanding of how to connect everything, and we started from back to front. Usually, I prefer coding the front-end and then plumbing in the back-end as it feels easier once you know where things sit, but it wasn't an option this time around.
Retrospective
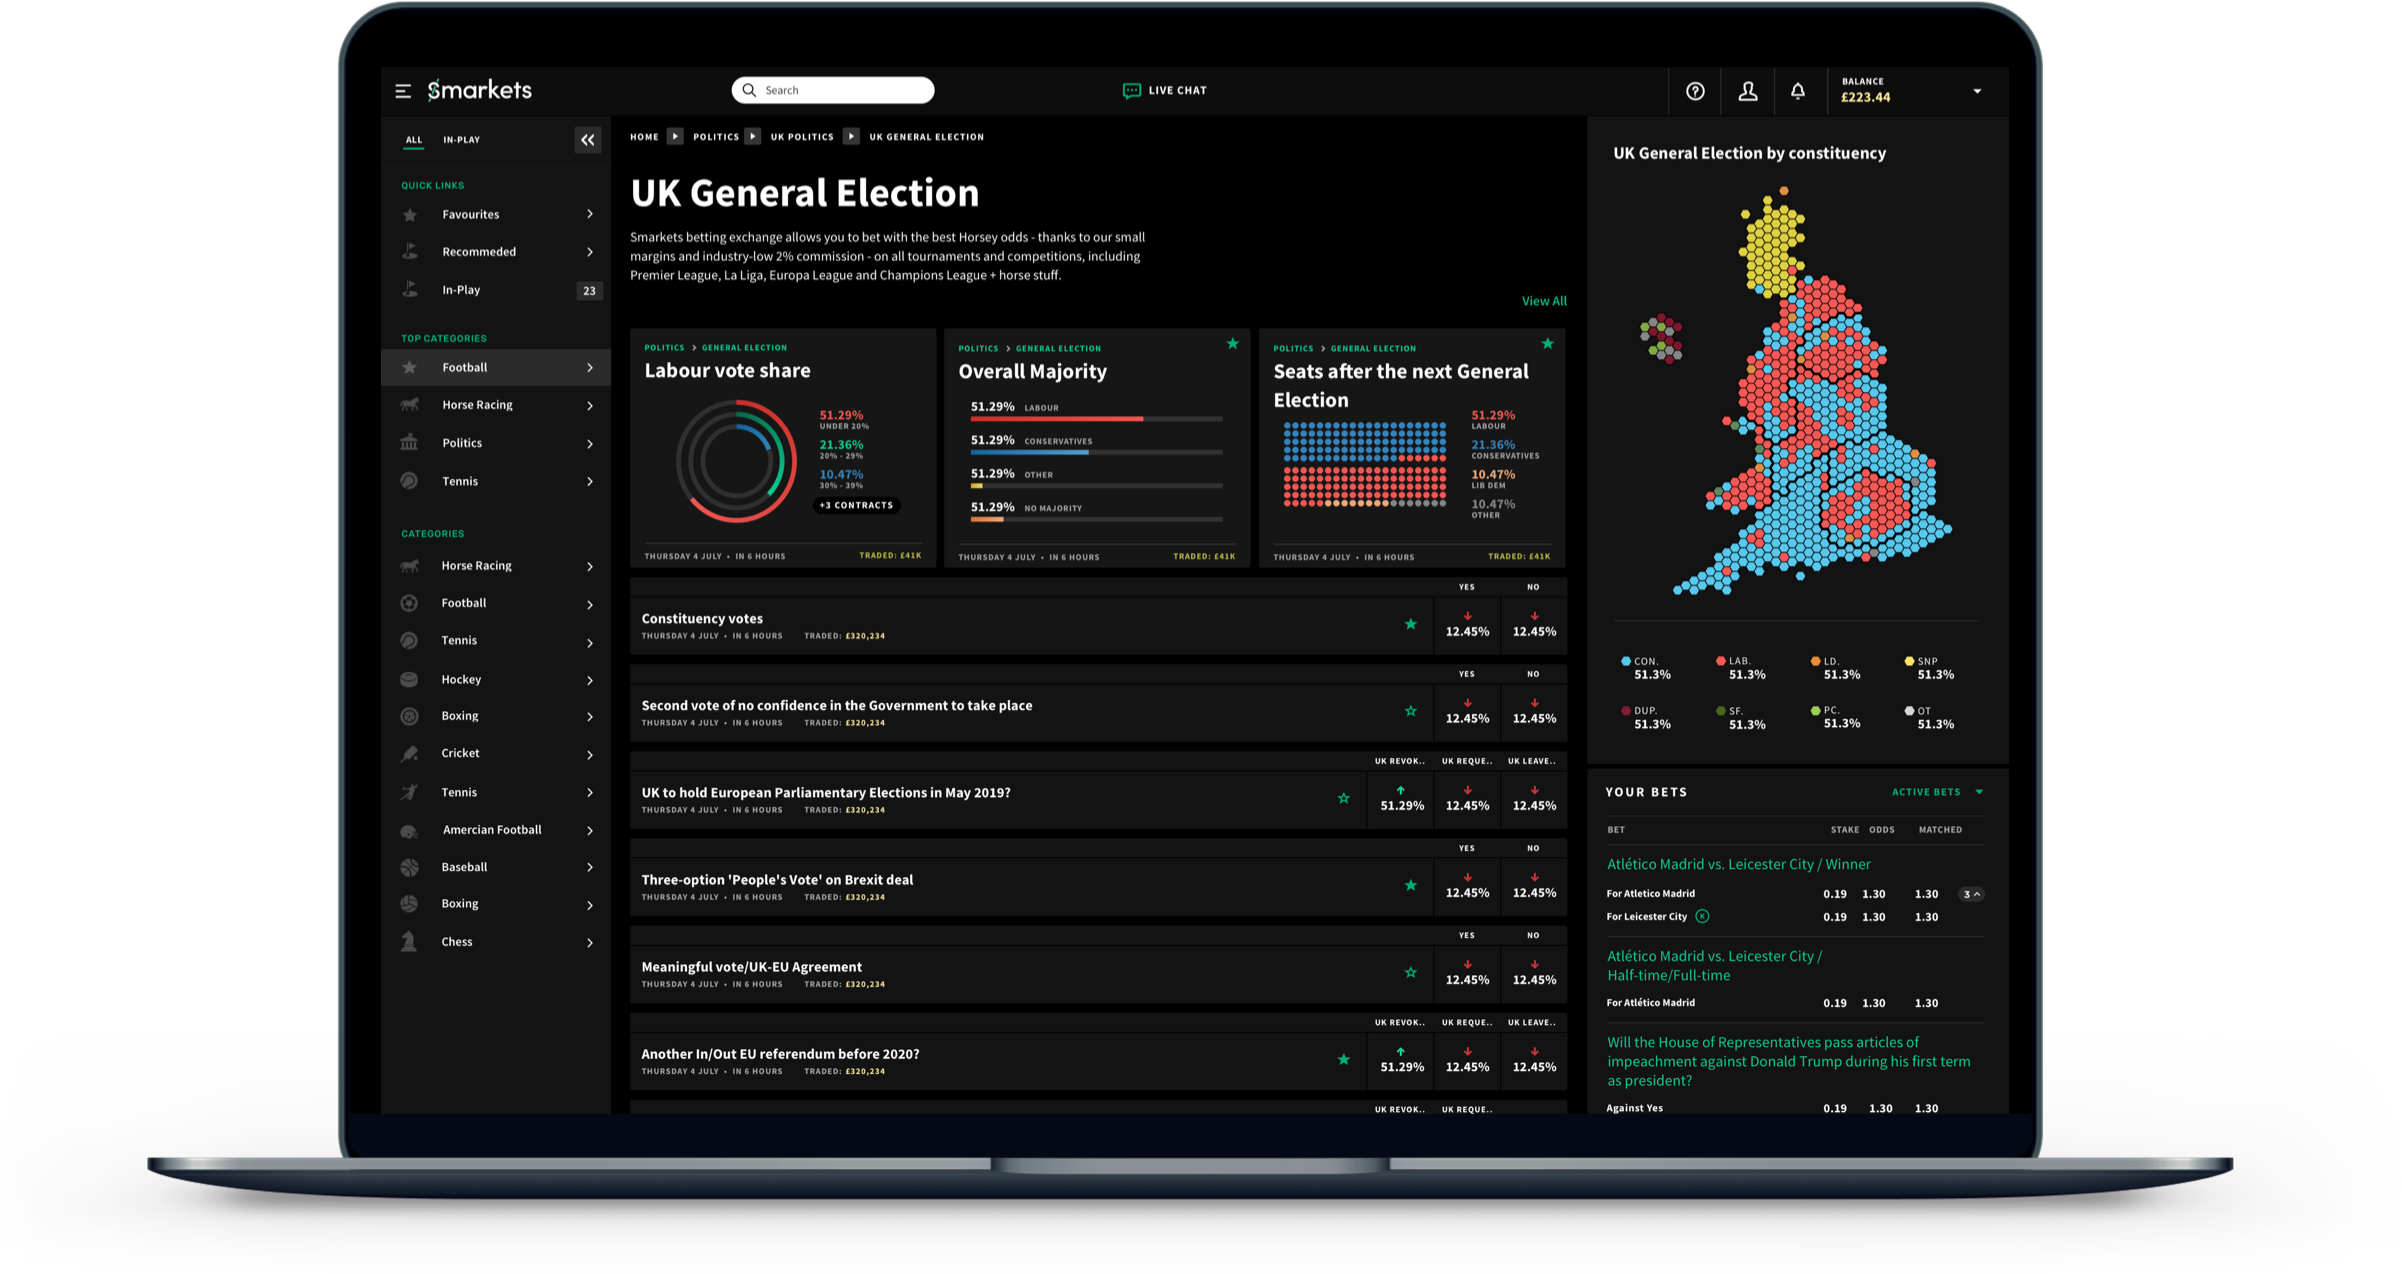
Although we managed to launch on time and with only minor technical issues, we received a somewhat consistent piece of feedback from visitors: "it looks good, but I can't do much". When looking at the metrics for the page, something that corroborated, we had a very high page duration but equally high drop off. We expected this, as we purposefully stripped back and limited the betting functionality to broaden appeal; however, we weren't counting on this as the appeal factor.
Taking this learning on board, along with a few others, we decided to iterate on the project. This time rather than taking the visualisation away from the site, we would incorporate them directly.
Copyright © 2021 Dean Harrison. All rights reserved.